
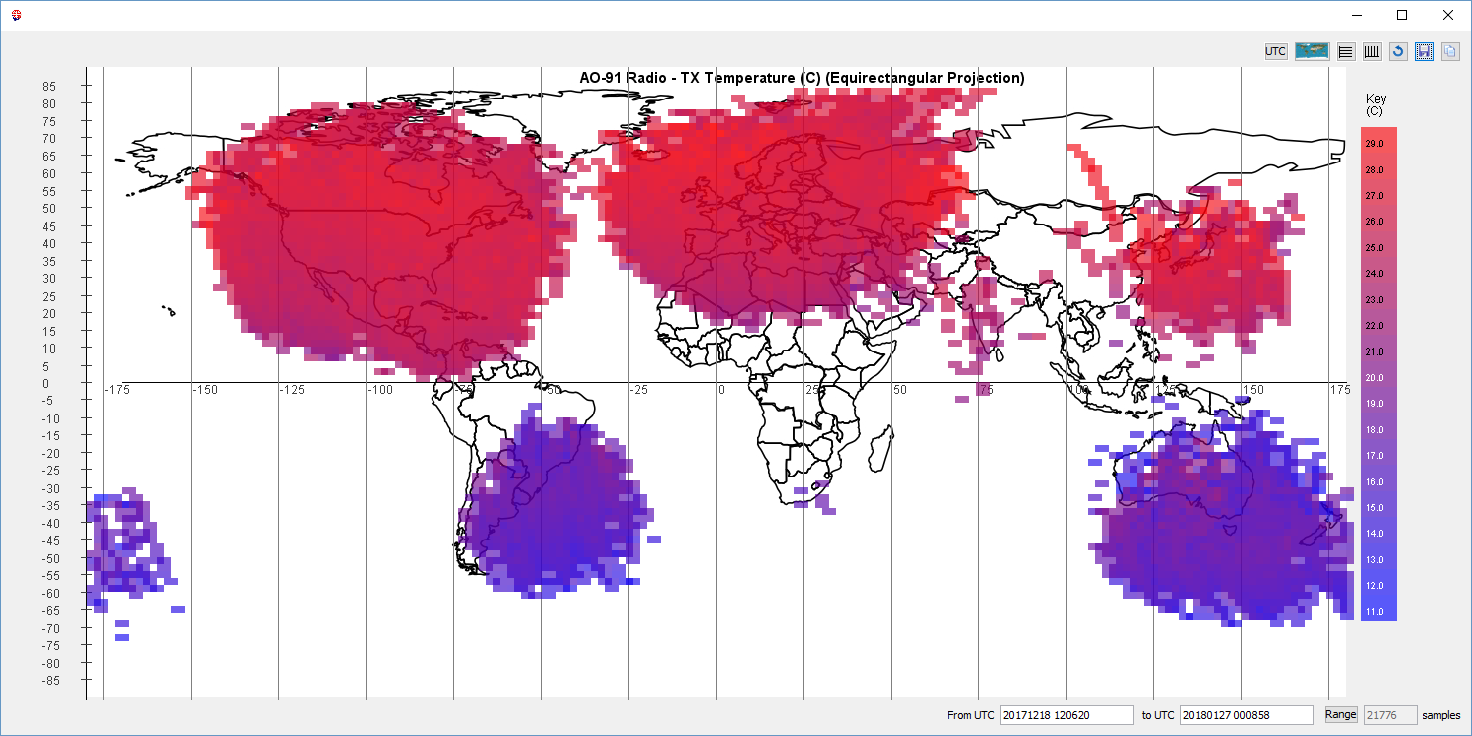
 In release 1.06 of FoxTelem we have the ability to plot a telemetry value as a heatmap on top of a map of the earth. This allows us to visually see how paramaters vary. For example, here is a plot of AO-91 (RadFxSat) showing the temperature of the Transmitter. Wow! Is it hotter when the spacecraft is north of the equator? How could that possibly be? Before we try to answer that question, let me show you how these plots work and how you can perform similar analysis on the data you have collected and the data from the AMSAT server.
First of all, to launch an Earth plot you pick any telemetry value (or measurement for that matter) and either Right Click or Ctrl-Click it. Instead of opening a graph, it opens an earth plot. In Version 1.06 and later the bottom right of all graphs and plots shows 180 Live samples of data from the spacecraft. By "Live" we mean the latest samples. If more samples are added then the plot is updated.
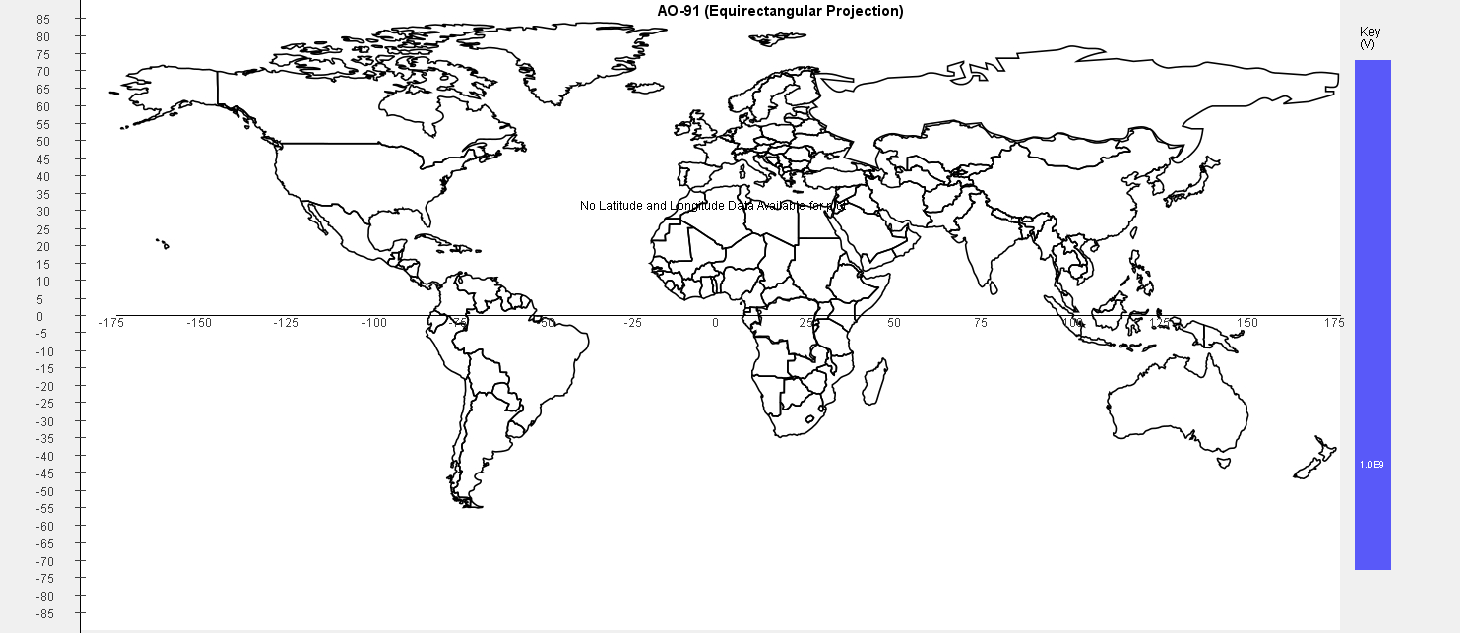
At first you may get no data shown, as in the plot. FoxTelem can only create these plots if it knows the UTC time for the spacecraft when the data was collected and if it has a set of kelperian elements, also called Three Line Elements or TLEs. I'll cover each dependency.
It's hard for us to know the time on our spacecraft as it orbits the earth. There is no real time clock. It can't connect to the internet and update its time from a trusted source. We could send a signal to synchronize the clock on board, but that would have to be done each time the computer resets. The challenge, specifically, is that we sometimes need to automatically cycle the power to clear an issue caused by radiation. If a solid state device has been hit by an energetic particle and locked on, then the spacecarft will automatically reboot to clear the issue. This disconnects the battery from the computer and resets the time to zero. So instead of a real time clock we keep track of the number of resets and the uptime of the computer. Each piece of telemetry is timestamped with those two values when it is collected.
On the ground we know what time we receive telemetry and we know how long it takes to marshall, transmit and decode it. When a reset happens AMSAT operations uses telemetry collected from trusted groundstations to calculate what we call T0. This is the time that a reset occured. T0 is stored on amsat.org. This file contains each reset and a Unix timestamp. FoxTelem checks that file each time it is launched. You can also view the contents of the file and pull down the latest file from the spacecraft configuration screen.
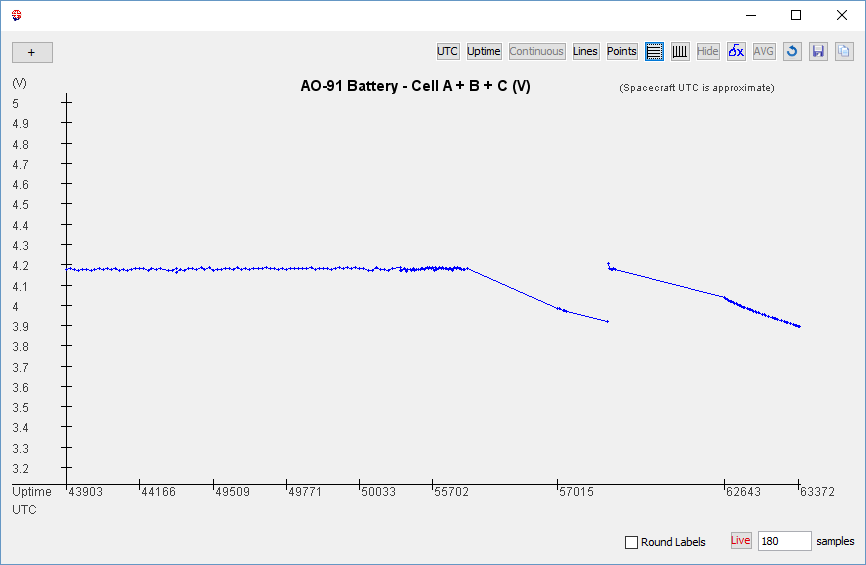
You can check that T0 is present by opening a normal graph. In the plot below, which shows the same 180 samples for the battery, we have pressed the UTC button in the middle at the top of the graph. This shows UTC time on the time axis, but it is blank. If we untoggle UTC then we see that the reset is 8. We do not have T0 for reset 8.
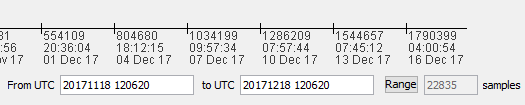
While we wait for AMSAT operations to update reset 8, we can plot some older data where the reset is known. So with UTC toggled on we click the "Live" button twice to toggle it to "Range". We then enter launch in the "From UTC" box. This gives us T0 for reset 0, as shown below. We can put a date one month later in the "to UTC" box. This gives us the first month of samples from AO-91, which covers resets 0, 1 and part of 2. We see that we have UTC times for this data.
We can use this range of dates in the Earth plot, but notice that FoxTelem needs to calculate spacecraft positions in the past. For the plots to be accurate we need to have the TLEs that were accurate at the time. We can not use the current TLEs and calculate a position two months ago. The orbital parameters have changed too much.
When you launch recent versions of FoxTelem is connects to amsat.org and downloads nasabare.txt. For each spacecraft you have configured it tries to extract the TLE. Rather than simply storing the TLE, FoxTelem keeps a history of all TLEs in a file in the spacecraft directroy. The first few records of my AO-91 file are shown below, showing that we started with the name RadFxSat and then switched after launch. Once in this file the name no longer matters. This file is indexed by "epoch", which is the third value on the line marked "1". At launch this was 17322.46018518, meaning year 17, day 322.46018518. The Epoch then increases with each line.
RadFxSat

1 00000U 17017A   17322.46018518 -.00000000  00000-0  00000-0 0  9995

2 00000  97.6969 254.4977 0258300 235.3028 178.8186 14.79656332  -137

AO-91

1 43015U 17073C   17322.72086064 -.00000076  00000-0  00000 0 0  9992

2 43015  97.6866 257.8586 0257216 236.5936 121.0430 14.77555309    57

AO-91

1 43016U 17073D   17324.81992359  .00000855  00000-0  73563-4 0  9991

2 43016  97.6901 259.8749 0259544 229.6727 128.1552 14.77757019   356
If we have valid TLEs and we know T0 for the dates and times we want to plot, then we will get a valid EarthPlot.
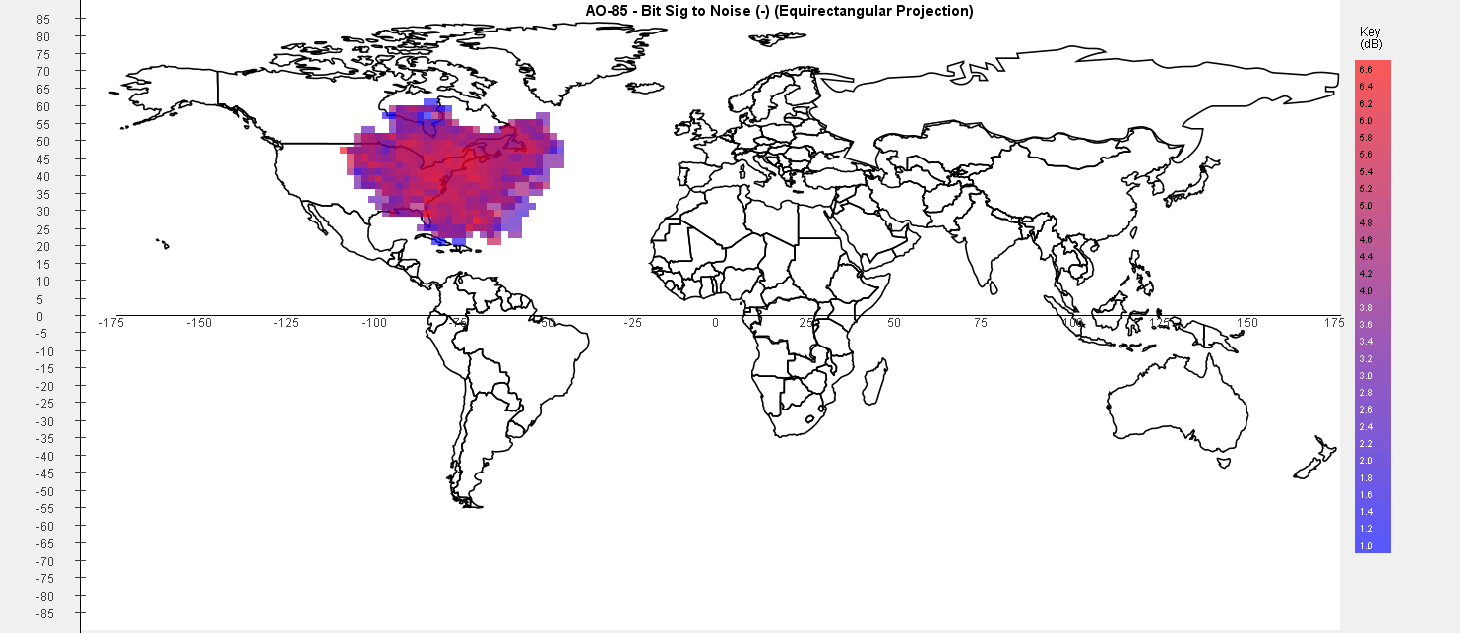
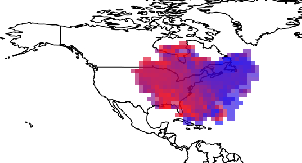
The examples above were plotted from the server data, but it is also very interesting to plot the data that you have downloaded locally. For starters, here is a plot of the bit Signal To Noise for AO-85 at my station in Brooklyn. We can see a cloud of data representing my radio horizon. Note the odd shape, with poor coverage to the north because of a large building. Also, as expected, we get the best Signal To Noise ratio when the spacecraft is overhead and often the poorest on the horizon, but there are some outliers. It is not a smooth transition.
Or here is the frequency of the downlink for the last month, as received at groundstation AC2CZ:
So let us return to the temperature of the AO-91 transmitter which is hotter when north of the equator than in the south. Why is that? It is vividly shown in the analysis and is likely due to sun angle or some other aspect of illumination. More analysis is needed. Analysis that you could do if it interests you.
That just scratches the surface of the analysis that you can do with the new Earth Plots. Write to me if you do some interesting plots or find out anything fun!
Enter Comments Here:
| On: 02/06/18 19:19 said: |
| On: 05/24/19 17:17 WP3K said: |
Way cool! Cheers. |
| On: 05/25/19 20:20 Chris / G0KLA said: |
All part of the fun of Amateur Radio :) |
| On: 02/15/21 7:07W0FAA said: |
I'm glad I stumbled across this site, it's fascinating stuff. Did you ever determine the answer? Aside from sun angle, etc. perhaps the transmitter is more active and thus hotter in the northern hemisphere where there are more hams? A new perspective on data is always interesting. Thank you. |
| On: 02/15/21 12:12 Chris / G0KLA said: |
Thanks for the comment W0FAA, I still don't know why it is. I like the idea that more stations used it in the northern hemisphere and therefor it is hotter. Given that heat does not flow very well in a vacuum, I would then expect this heating to be localized to the transmitter and not as pronounced in the other components. So we might be able to analyze this further by looking at the other temperatures. I've not had a chance to do that. |
| On: 12/03/25 17:17 said: |
Copyright 2001-2021 Chris Thompson
Send me an email