
The recent set of images collected from AO-92 were an attempt to capture Hurricane Florence but they were chaotic. It was as though the storm itself had reached up into space and distrupted our Spacecraft. I suspected that rotation around Z was too fast during the most recent run and set out to investigate.
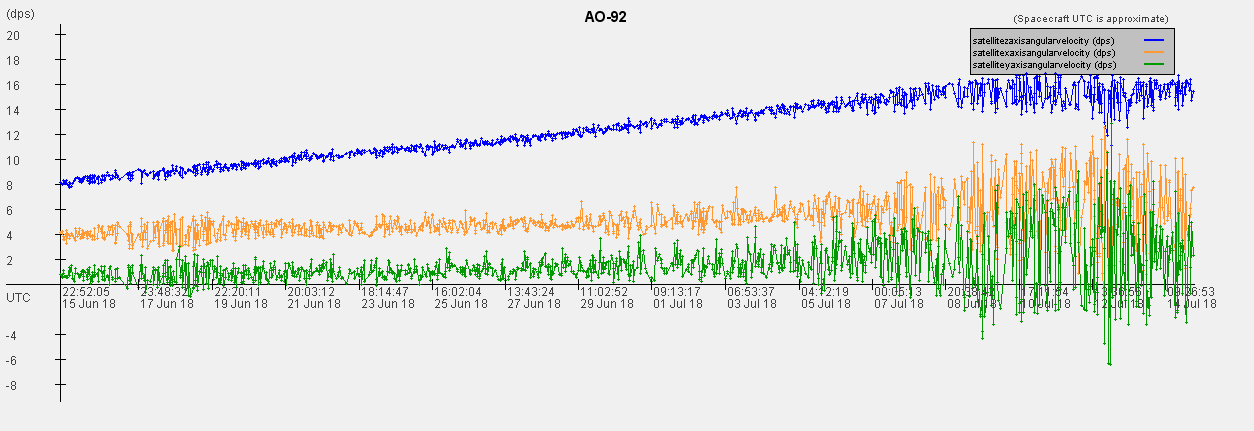
Below is a plot in blue of the Z rotation from June 15 to July 15. The set of images before the hurricane were acquired July 10-12, and were pretty good. We can see that the spacecraft was rotating around Z at up to +15 degrees per second (dps) or one rotation every 24 seconds. It had grown in speed just before the images were acquired, but it was still stable-ish. X and Y rotation are shown too and are starting to be more chaotic, but apparently this was manageable as most of the images were good.
If we plot for the last month we see that we happened to be in a turbulent period when the rotation was resetting from positive to negative. I've shown two plots because we loose the Z rotation in blue behind the chaos of the other axis.
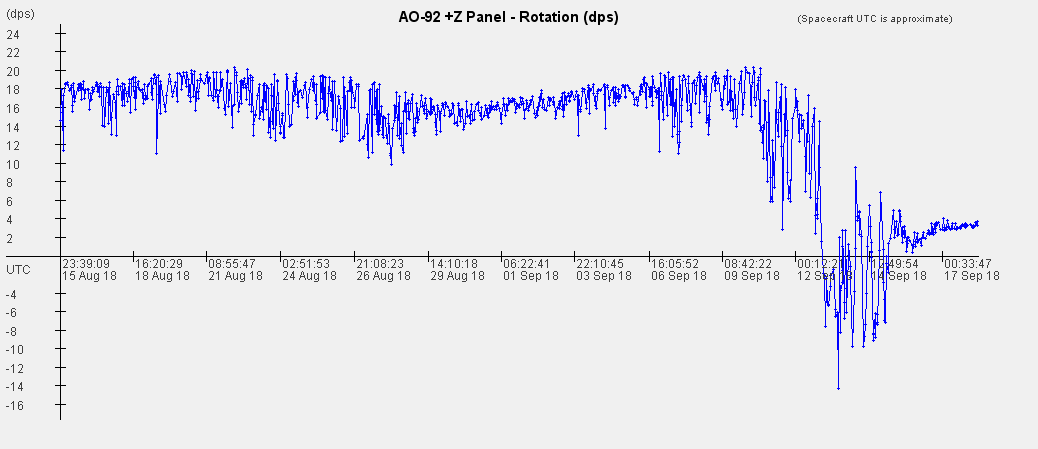
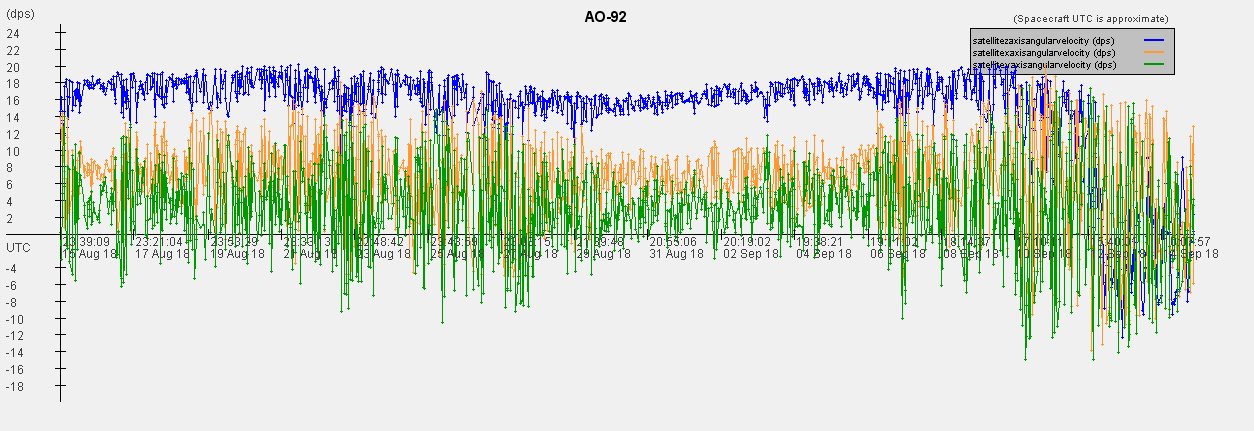
But why did that happen? On AO-85 changes in rotation are due to changing sun exposure and we see a correlation with the temperatures. So usually I can plot the temperature of the spacecraft and see that the rotation changes as it heats or cools. But I don't see that here.
So does anyone know why were were unlucky and hit this patch of turbulence? If you have thoughts, post in the comments below.
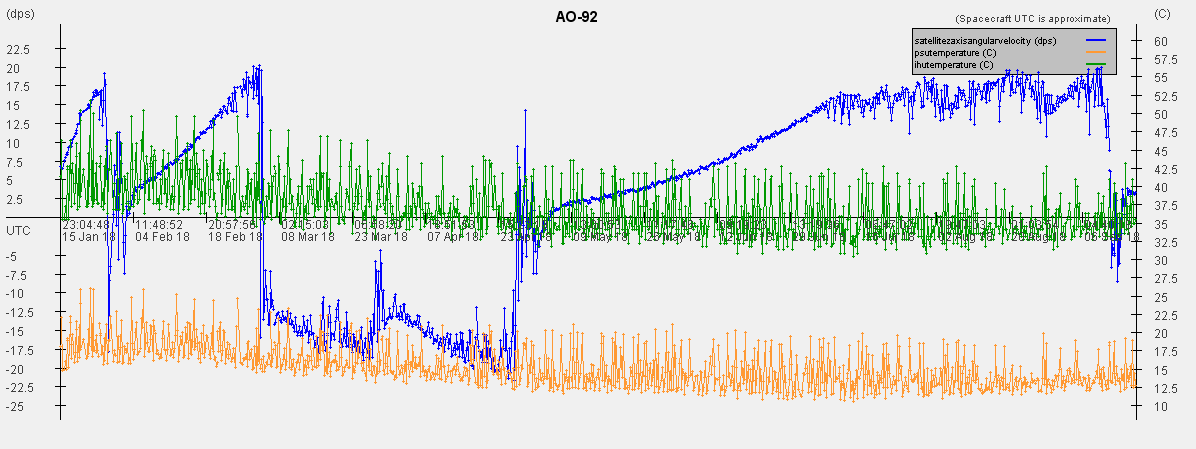
Looking at the spacecraft this year, we see several resets of the rotation rate. I have plotted PSU and IHU temperature against Z rotation below to show that we do not have the dramatic temperature shifts we see in AO-85. In fact the temperature stays in a narrow range.
That is backed up by plotting when we are in sun. Here is a plot just for a few days before the chaotic movement during the storm. It is hard to tell any change in sun pattern that caused the change in rotation. So what is going on? Any thoughts?
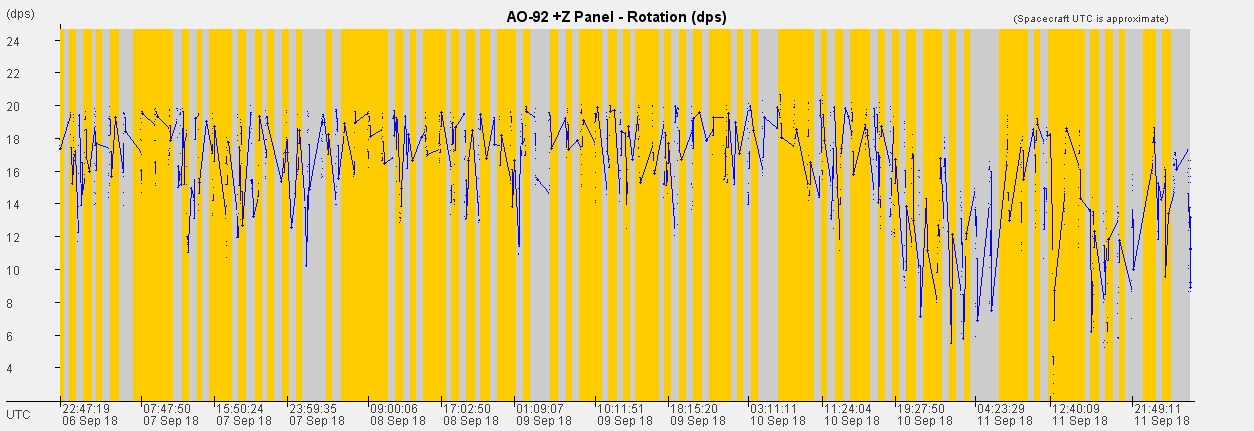
One conclusion from this review is that we can use the rotation to pick good times for future image runs. You can see all this data easily from FoxTelem if you pull down the server data.
Jerry Buxton, N0JY, looked at this and pointed out that there was a geomagnetic storm from Sept 11:
Space Weather Message Code: WARK06
Serial Number: 424
Issue Time: 2018 Sep 11 1110 UTC

EXTENDED WARNING: Geomagnetic K-Index of 6 expected
Extension to Serial Number: 423
Valid From: 2018 Sep 11 0805 UTC
Now Valid Until: 2018 Sep 11 1500 UTC
Warning Condition: persistence

NOAA Space Weather Scale descriptions can be found at
www.swpc.noaa.gov/noaa-scales-explanation

Potential Impacts: Area of impact primarily poleward of 55 degrees Geomagnetic Latitude.
Induced Currents - Power grid fluctuations can occur. High-latitude power systems may experience voltage alarms.
Spacecraft - Satellite orientation irregularities may occur; increased drag on low Earth-orbit satellites is possible.
Radio - HF (high frequency) radio propagation can fade at higher latitudes.
Aurora - Aurora may be seen as low as New York to Wisconsin to Washington state.
I pulled up a plot of the Planetary Kp index (3 hour range index)from Potsdam
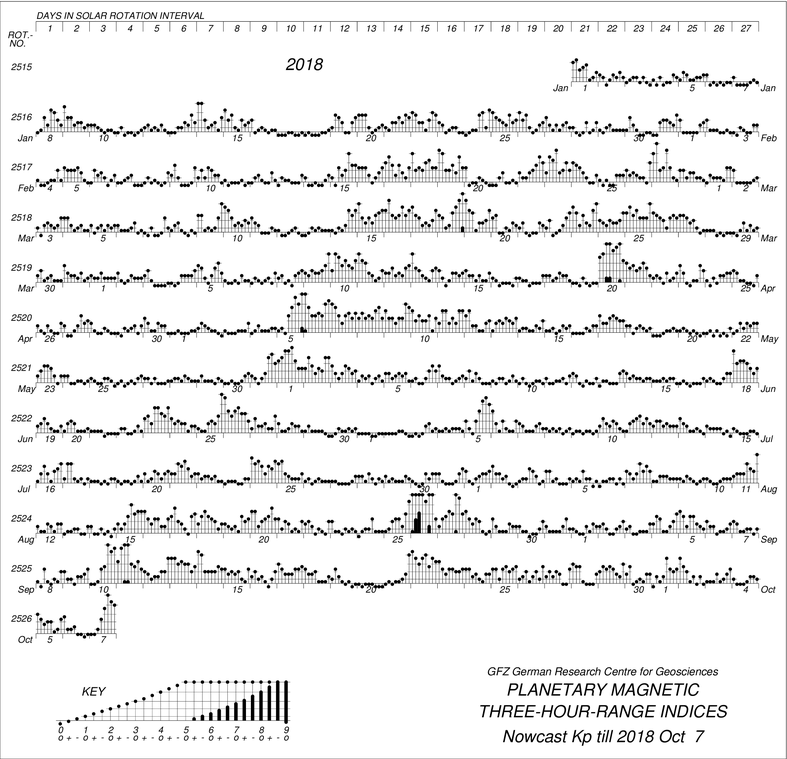
But the correlation is not good. Take the end of January for example, when the spacecraft rotation was chaotic but geomagnetic activity from the sun was calm. But this is a good avenue of analysis. There are lots of measurements of spcae weather and perhaps one of them correlates with the disturbances to our spacecraft.
Enter Comments Here:
Copyright 2001-2021 Chris Thompson
Send me an email